 Reporting
Reporting: Education Reports and Analysis
All traces of education in one report
Get detailed reports about your training sessions, live lessons, exams and online sales. See who has completed which content and how many exams they took based on person and education; Export reports in audit-ready format.

 Education
reports
Education
reports Participation
reports
Participation
reports Exam
reports
Exam
reports Outward
transfer
Outward
transfer AI-powered
report summary
AI-powered
report summary
Single flow from data to decision
Training, live lessons, exam and certificate data are collected on a single platform. View and export reports by person and training; Get the summary and see action suggestions with artificial intelligence.

- 1Collect Data
- 2Select Report
- 3Review Results
- 4Export
- 5Take Action
What can you do with reporting?
Vedubox makes every step of your training processes measurable and auditable.

Training Reports
See who has completed which content by person and education.

Exam Reports
Track which exam scores you received and the results.

Participation Reports
See exact attendance times in live classes and meetings.

Content Consumption
Track how much content participants consume.

Sales and Income Reports
Report your online sales, daily and monthly income.

Audit Ready Export
Export reports in an audit-ready format.

Report Summary with AI
Summarize management reports in seconds and get recommended actions.

Instructor Reports
Instructors see their students' reports and analysis.
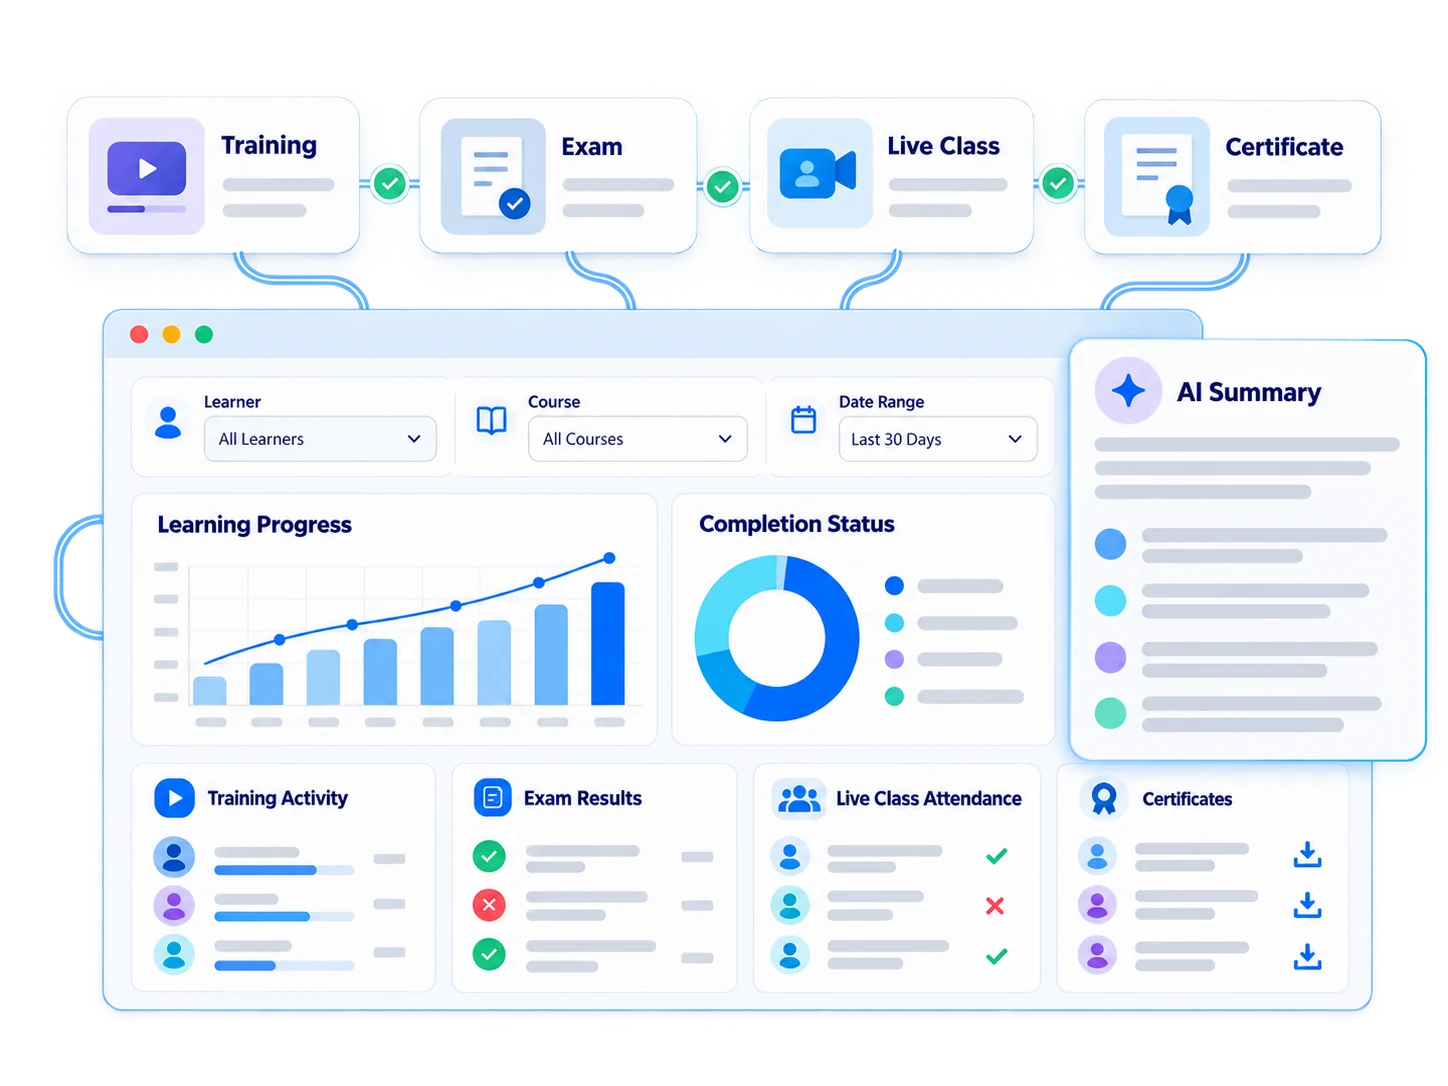
Not just a table, but a decision support tool
Reporting; It connects training, exam, live course and certificate data, keeping all traces of a training in one place.
- See completion by person and education
- Watch exam results
- Report live course attendance times
- Export audit-ready reports
- Get report summary with AI
For every audience, measurable education

Employees
Mandatory training and compliance reports

Customers
Customer training reports

Sales Teams
Sales training and success reports

Dealers / Partners
Dealer training and certification reports

Universities
Student success and parent reports

Training Companies
Program, participation and revenue reports
Reports are ready on the audit day
In a regulated industry such as aviation or healthcare, collect which employee completed which training and when, exam results and live course attendance times in a single report; Export in audit-ready format.

Ecosystem
Reporting works with other components of the Vedubox ecosystem.

Reporting
Report results

Dropout Radar
Identify risks early

Skills Analysis
Identify competency gaps

Exams and Question Bank
Manage your exams

Live Training
Organize live lessons

LMS / LXP
Publish and manage training

Certificates
Recognize achievement

AI Assistant
Support learning with your organization’s knowledge

Training Sales
Sell on your own channel
WhyReporting?

Instant visibility
Training data does not wait to be collected, it is ready in the report.
Single source
Training, exam, live lesson and certificate data are in the same place.

Audit ready
Reports are ready to export.

AI summaries
Long reports are summarized in seconds.

One Platform
Reporting works with all Vedubox modules.

Built for Enterprise Scale
Monitor the data of all units and locations from one place.
Manage your training with data
Measure and report completion, success and engagement in one platform.