


Imagine a board meeting where the L&D department prepared an immaculate report. Compliance training completion rates are 95 percent, and the new leadership program saw 100% attendance. But then your CFO leans forward and asks the chilling question: “That’s nice, but has it actually improved our bottom line?”
In a tough economic climate, every expense is under scrutiny. Simply showing activity is not enough. For L&D to secure its place and budget, it needs to show clear, measurable results for the business.
L&D teams now build their credibility on the reports they produce. If they rely only on numbers like attendance and completion rates, they risk being seen as just another cost. To shape decisions, L&D needs to show how its work affects profit and reduces risk.
The Problem with “Happy Sheets” and Vanity Metrics
For years, L&D has measured success with numbers that look good on paper but say little about real performance. These “vanity metrics” include:
- Course Completion Rates: The percentage of employees who clicked through all slides.
- Hours Learned: The total time spent on the platform.
- Attendance Figures: Who showed up to the virtual classroom or seminar?
- Satisfaction Scores (“Happy Sheets”): Did employees enjoy the training?
These numbers are easy to find in any learning management system, but they do not show whether training has made a difference to the business.
Consider a crucial compliance module, perhaps relating to GDPR or the Financial Conduct Authority (FCA). A 100% completion rate merely confirms everyone opened the course. It provides no guarantee your organization is safe from a breach or regulatory fine.
The CIPD’s Learning at Work Survey points out a common problem. L&D is essential for keeping people and building skills, but often there is a gap between what L&D measures and what the organization needs. If your reports cannot close this gap, your budget may be at risk. L&D needs to show evidence of real competence, not just attendance.
3 L&D Impact Metrics Your Board Wants to See
To move L&D from a cost to a source of value, focus on metrics that clearly connect to business results.
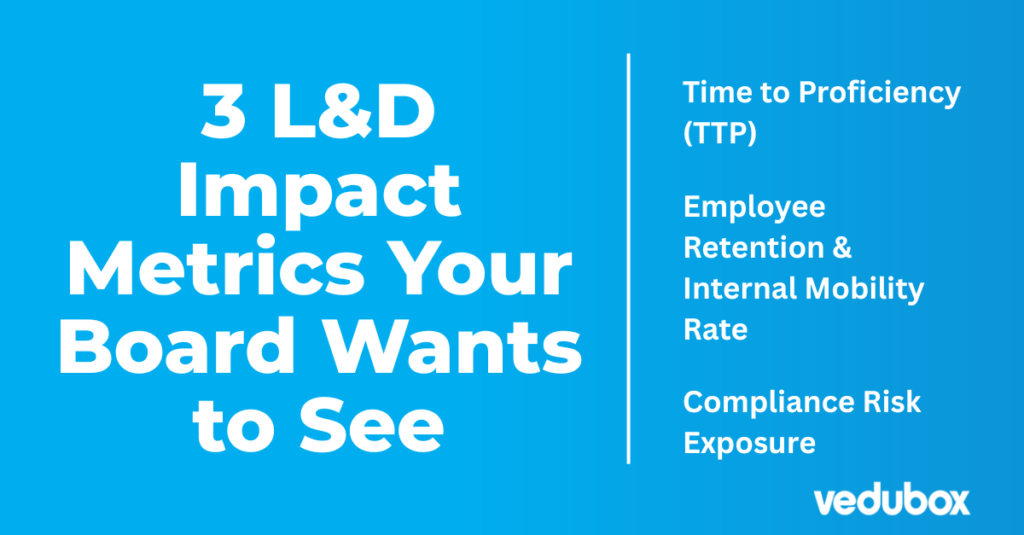
A. Time to Proficiency (TTP)
Even if hiring costs are falling in some places, the true cost of a new employee includes not just recruitment fees but also the time it takes for them to become fully productive.
Shortening the time it takes for a new employee to reach full productivity saves money and helps the business grow faster. Track the time from when someone starts to when they regularly meet the key targets for their job.
B. Employee Retention & Internal Mobility Rate
Recruitment costs for senior roles are even higher than for junior or mid-level team members. In the UK, for example, it may exceed £40,000. Therefore, retention becomes a critical financial metric.
L&D helps keep employees engaged and loyal. When people see clear opportunities to develop, they tend to stay. Compare participation in learning programs with actual staff turnover to see the impact.
C. Compliance Risk Exposure (The “Sleep at Night” Metric)
In regulated sectors such as finance, pharmaceuticals, or aviation, the main concern is avoiding serious risk. A large regulatory fine can have a direct and heavy impact on the business.
You must prove training ROI by showing risk reduction, not just activity. Don’t track completion; track gap closure. Use your system to identify and report on the number of high-risk employees (e.g., those handling sensitive data or operating specific machinery) whose mandatory certifications are due to expire or who scored below the acceptable threshold on required exams.
How to Automate Your LMS Reporting with Vedubox
You can’t manually cross-reference HRIS performance data with Excel training sheets. Your team is already stretched, and the board demands real-time data.
A modern learning management system like Vedubox can help. Its reporting tools automate the hard work of bringing data together.
Advanced Reporting & Analytics
With modern LMS reporting, you can connect what people learn to real business results.
- Performance Integration: Go beyond tracking who finished. Link exam scores from the online system to key targets for each department, such as matching high product knowledge scores with better sales results.
- Risk Profiling: Use the system to automatically flag employees in high-risk roles whose certifications are expiring, allowing you to proactively manage compliance before it becomes a crisis.
- CPD Tracking: Easily track which employees are engaging in continuing development, providing the necessary data to calculate retention correlation.
By using a powerful learning management system report, you shift from reactive data compilation to proactive business intelligence.
Moving from “Did they learn?” to “Did they improve?”
Consider two companies with the same problem: too many customer calls being escalated.
Company A tracks only completion. They run a conflict resolution course and report that 99% finished it. The board notes the effort but sees no clear business result. The budget stays the same.
Company B uses Vedubox to track impact. They run the same course, then use LMS reports to compare training with call center results. Their report shows that the customer service team that took the course reduced call escalations by 15% the next month.
Reporting only on activity is no longer enough. To earn long-term investment, L&D needs to show who has improved, not just who attended.
It is possible to show the value of training, as long as you have the right tools. With advanced LMS reports, L&D can move from being a cost to becoming a partner that improves performance, reduces risk, and helps the business grow.
Struggling to get the actionable data you need to impress your CFO?
Book a demo to see Vedubox’s advanced LMS reporting dashboard in action and discover how seamless data correlation can transform your L&D strategy.